
The Yorkshire and the Humber region has lost more than 4% of its NHS jobs since the election, more than double the national rate, according to data published last week by the NHS Information Centre. The East of England and North West regions lost more than 3% of their NHS jobs.
With a couple of exceptions, the poorer areas of England lost more NHS jobs than average while richer regions lost fewer, between May 2010 and October 2012. Two NHS regions actually gained NHS jobs over this period: South East Coast, up 0.75%, and the North East (which has the most NHS jobs per resident of any region, with more than 24 full-time equivalent (FTE) health service staff per 1,000 residents), rising 0.53%. London and South Central reduced FTE staff numbers by less than 1%.
| (Full time equivalent posts) | NHS jobs May 2010 | NHS jobs Oct 2012 | Change | % |
| Yorkshire and the Humber | 115,253 | 110,758 | -4,494 | -4.1 |
| East of England | 95,647 | 92,683 | -2,964 | -3.2 |
| North West | 163,220 | 158,396 | -4,824 | -3.0 |
| East Midlands | 80,869 | 78,683 | -2,185 | -2.8 |
| West Midlands | 111,824 | 109,633 | -2,191 | -2.0 |
| South West | 101,126 | 99,160 | -1,965 | -2.0 |
| ENGLAND | 1,056,652 | 1,037,284 | -19,368 | -1.9 |
| London | 166,258 | 165,494 | -764 | -0.5 |
| South Central | 67,214 | 67,001 | -213 | -0.3 |
| North East | 63,734 | 64,070 | 336 | 0.5 |
| South East Coast | 72,118 | 72,664 | 546 | 0.8 |
The Information Centre has also published staff numbers for each NHS employer over this period. It’s more difficult to analyse, as there have been a large number of mergers over the last few years, with primary care trust staff community healthcare staff transferring to acute hospitals and mental health trusts. More recently, PCTs have been running themselves down in preparation for their abolition at the end of March.
However, a comparison of full-time equivalent posts at the big hospital trusts in Yorkshire and Humber in October 2011 (after community PCT staff were absorbed) and October 2012 shows many have been shrinking. Hull and East Yorkshire Hospitals lost more than 4% of its staffing over the 12 months, Calderdale and Huddersfield 3%, Doncaster and Bassetlaw Hospitals just under 3% and Sheffield Teaching Hospitals 1%. Leeds Teaching Hospitals was an exception, adding just over 1%.
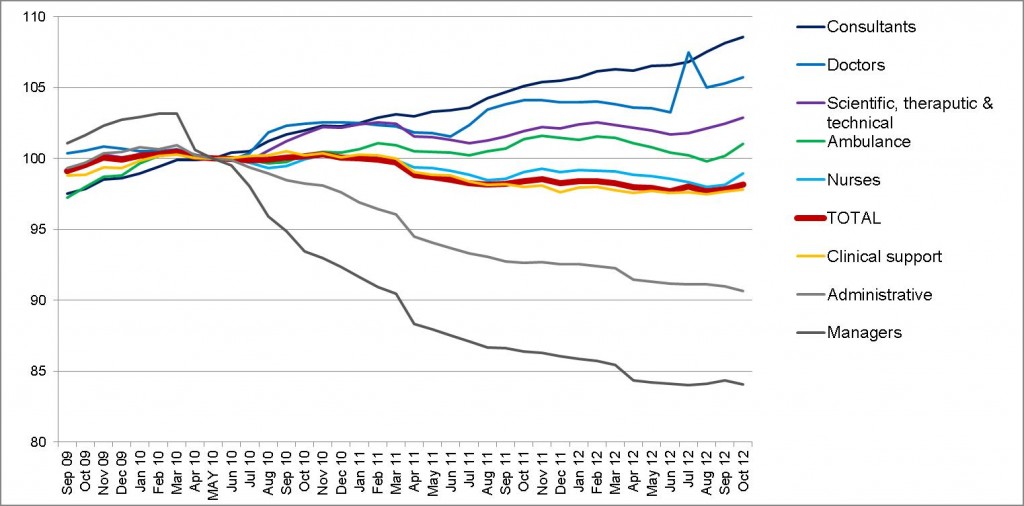
The NHS Information Centre has also updated its all-England NHS jobs figures, graphed above (click to see a larger version) and in table form below. Many of the trends I noted in November continue – the numbers of doctors continues to climb, particularly consultants, with a rise of 8.6% in the latter since May 2010. Some trends seem to be changing: the number of nurses has bounced back, as have ambulance staffing numbers; and while the number of administrative staff continues to shrink, the drop in managerial jobs seems to have bottomed out. NHS managers were heximated between the election and April last year – in other words, one in six posts vanished – but since then the numbers have been pretty stable.
| (Full time equivalent posts) | NHS jobs May 2010 | NHS jobs Oct 2012 | Change | % |
| Doctors | 97,729 | 103,346 | 5,617 | 5.7 |
| inc. consultants | 36,762 | 39,906 | 3,144 | 8.6 |
| Nurses | 310,793 | 307,545 | -3,249 | -1.0 |
| Scientific, theraputic & technical | 129,700 | 133,453 | 3,752 | 2.9 |
| Ambulance | 17,727 | 17,910 | 183 | 1.0 |
| Clinical support | 296,008 | 289,496 | -6,512 | -2.2 |
| Administrative | 204,695 | 185,535 | -19,160 | -9.4 |
| inc. managers | 42,267 | 35,533 | -6,733 | -15.9 |
| TOTAL | 1,056,652 | 1,037,284 | -19,368 | -1.8 |