
I have produced digital mapping for editorial and other purposes, including choropleth maps of the UK, in particular ones that use areas such as local authority, NHS and other administrative boundaries. I draw on my experience in producing online mapping in my data journalism training.
Mapping portfolio
Changing populations of UK local authority areas
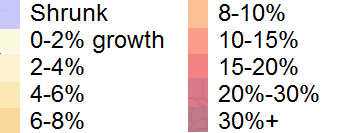
A choropleth map highlighting that 22 areas actually shrunk in population over the decade to 2016, including Kensington and Chelsea. Source: Office for National Statistics. Custom-produced with Leaflet; read more about this map
Economies and populations of English mayor-run city regions
Relative economic outputs shown by coloured circles, populations by black circles. Source: Office for National Statistics. Custom-produced with Leaflet; read more about this map
Birthplaces of individual Team GB Rio 2016 medal-winners
Source: Team GB. Produced with Mapbox; read more about this map
Global urban health challenges and solutions
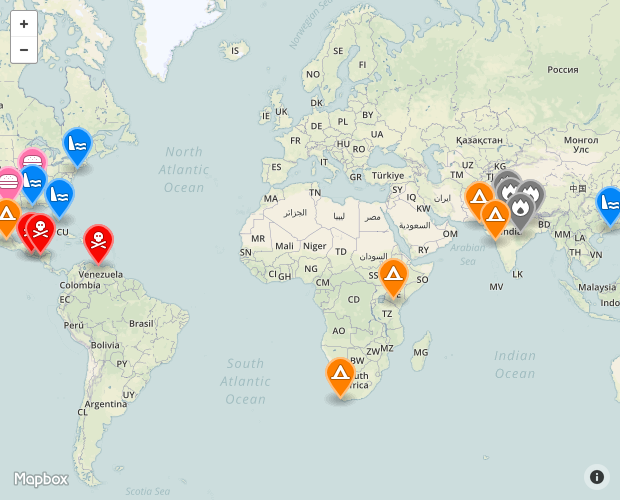
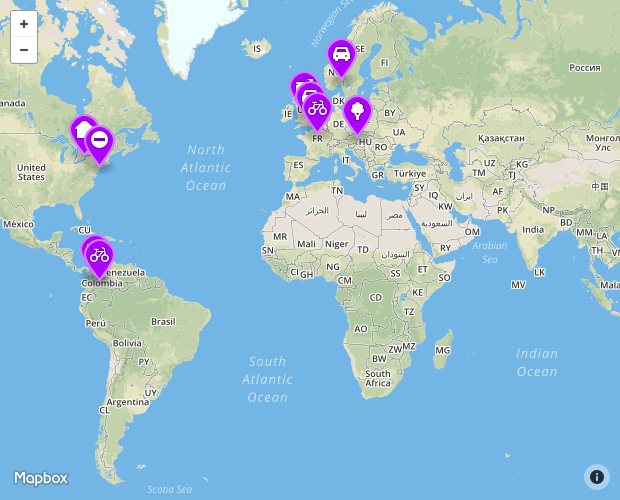
Sources: various. Produced with Mapbox and published by Guardian Healthcare Network in November 2015. Replaced in 2020 with static images as Mapbox is withdrawing the service these were built with.