Time to drop digital booking barriers for visitors

I have been visiting museums and galleries over the summer, partly to write a Geek’s Guide for the Register on Oxford University’s history of medical science leading to its ChAdOx1 nCoV-19 vaccine, partly for the joy of it. But some visits are marred by unnecessary digital barriers put up during the pandemic that should now be scrapped.

One museum (not in Oxford) required separate timed online tickets to enter and for each special exhibition, which meant guessing how long you would spend in one exhibition to meet the 30-minute time-slot for the next one. One gallery was asking visitors at its door to book a free online ticket before entering, although it looks like it has since changed its policy. Continue reading “Time to drop digital booking barriers for visitors”

EU Settlement Scheme needs to level-up locally

It would be nice if all data was easily comparable and highly accurate, but it’s not. Office for National Statistics numbers on nationality of people in local authority areas are rounded to the nearest thousand to reflect the fact they are survey-based estimates. The ONS recently pointed out a range of problems involved in comparing this dataset to Home Office data on applications to the EU Settlement Scheme.

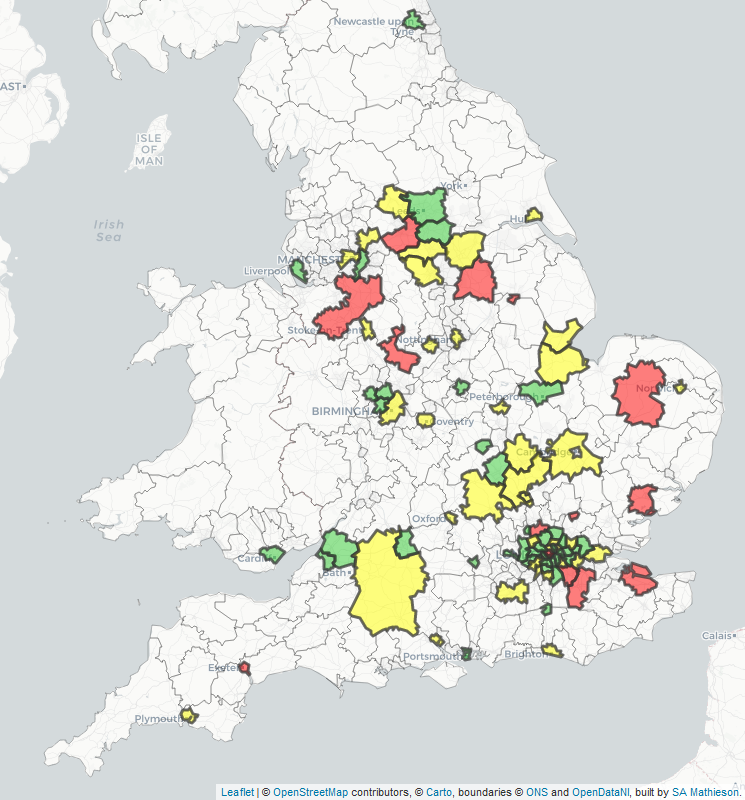
I still made these comparisons for PublicTechnology, because the differences between areas are huge. Excluding Irish citizens (who generally don’t need to apply to stay in the UK post-Brexit), the number of applications to the EU Settlement Scheme is equivalent to about three-quarters of 3.6 million European citizens in the UK. But for Bassetlaw in Nottinghamshire and Sevenoaks in Kent, it is around one-quarter.

Map of EU Settlement Scheme applications and non-Irish European populations Continue reading “EU Settlement Scheme needs to level-up locally”

Littler Britain: the 14 council areas with falling populations

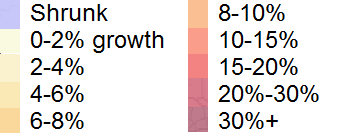
The Office for National Statistics has just published its annual population estimates for mid-2018. I have updated a map I first produced two years ago, showing how each area’s population has changed between 2008 and 2018. As well as the colour-coding, you can see the percentage change by hovering over an area. The data is derived from sheet MYE5 of this spreadsheet.

There are 14 council areas whose populations have fallen over the decade (shown in blue), while the UK’s population as whole grew by 7.5%. Most of them are rural and coastal areas: in England they include Cumbria, the Isles of Scilly and (an exception to the rural bit) Blackpool; in Wales, Ceredigion, Powys and Blaenau Gwent. In Scotland, seven council areas have fallen in population, mostly on the west coast: Argyll and Bute, Dumfries and Galloway, Na h-Eileanan Siar (the Western Isles), Inverclyde, North Ayrshire, South Ayrshire and West Dunbartonshire.

Continue reading “Littler Britain: the 14 council areas with falling populations”

Britain’s shrinking councils: Blackpool, Ceredigion… Kensington and Chelsea

According to recently-released data from the ONS, there were 4.82 million more people in the UK on this date in 2016 than on 30 June 2006, an increase of 7.9%. Many cities and big towns are growing much faster, with Manchester, Coventry, Peterborough, Luton, Milton Keynes, Slough and Bournemouth all up by more than 15%.

But 22 top-tier council areas (unitaries or county councils) have actually seen a fall in population over that decade. With one exception, they fall into two groups. Some are badly-off remote rural areas including Cumbria, Na h-Eileanan Siar (the Western Isles) and Ceredigion in Wales. Others are badly-off urban and suburban areas in the north of England and Scotland including Blackpool, Knowsley and Sefton on Merseyside and several authorities around Glasgow – although not the City of Glasgow itself, which grew 8.2%.

Continue reading “Britain’s shrinking councils: Blackpool, Ceredigion… Kensington and Chelsea”