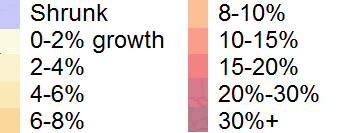
The Office for National Statistics has just published its annual population estimates for mid-2018. I have updated a map I first produced two years ago, showing how each area’s population has changed between 2008 and 2018. As well as the colour-coding, you can see the percentage change by hovering over an area. The data is derived from sheet MYE5 of this spreadsheet.
There are 14 council areas whose populations have fallen over the decade (shown in blue), while the UK’s population as whole grew by 7.5%. Most of them are rural and coastal areas: in England they include Cumbria, the Isles of Scilly and (an exception to the rural bit) Blackpool; in Wales, Ceredigion, Powys and Blaenau Gwent. In Scotland, seven council areas have fallen in population, mostly on the west coast: Argyll and Bute, Dumfries and Galloway, Na h-Eileanan Siar (the Western Isles), Inverclyde, North Ayrshire, South Ayrshire and West Dunbartonshire.

All of the six fastest-growing areas of the UK are in London, led by Tower Hamlets on 37%. But the capital also has one area where the population has fallen – Kensington and Chelsea.
This has also been published through my monthly newsletter. Sign up below.
