Land accounts for 51% of the UK’s total net worth of £10.2 trillion, far more than in France (42%) or Germany (26%). Most of this, £4.1 trillion, is the value of the land our homes are built on – the buildings are worth a further £1.8 trillion.
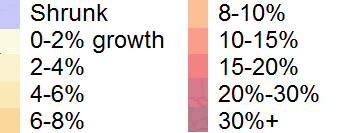
From 2009 to 2017, the Office for National Statistics reckons that land held by households has risen by a compound annual growth rate of 5.9%. But that disguises huge local differences. I compared the latest June 2018 data from the Land Registry’s House Price Index to that of a decade earlier, and found that in 42 of the UK’s 217 top-tier local authority areas house prices have actually fallen in cash terms over the decade. They are marked pink and red on this map.
Continue reading “The profit-loss divide on a decade’s house prices”

