Earlier this month, the Royal College of Nursing said that 61,276 posts in the English NHS have either gone since the general election, or are at risk. This figure comes from numerous sources including trust board papers, so it’s hard to check. But the RCN also says that the number of posts that have actually gone since May 2010 is 20,790, using NHS Information Centre data. While correct on publication, this now needs updating – NHS jobs in England are now down 24,221 between the election and August this year (in terms of full-time equivalent posts, FTEs), a 2.3% reduction in the workforce.
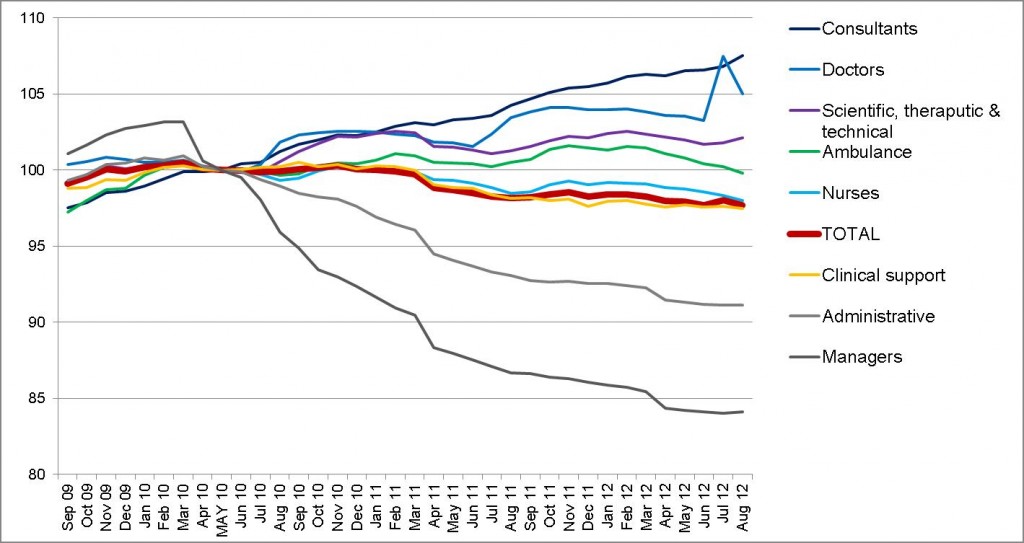
It’s obvious why the RCN is particularly angry: the mix of NHS jobs is changing – and not in favour of nurses. The graph below and the table at the end of this post shows the relative changes in the number of staff employed in some key roles (some are subsets of others), as well as the overall trend in red, with May 2010 as 100. The number of directly-employed doctors (not including GPs) is up by 5% – or 4,878 FTEs. That includes 2,766 more consultants, a group rising even faster, up 7.5%. Qualified scientific, therapeutic and technical posts (such as radiographers) are up 2.1%, representing an extra 2,761 FTEs.
Change in NHS job numbers since May 2010

However, there are 2% fewer nurses, but there’s a lot of them (still well over 300,000 FTEs), so that alone represents 6,288 fewer FTEs. The similarly large group of clinical support staff is down by 2.5%, or 7,481.
What this shows among those in jobs directly providing healthcare is a shift from less-qualified lower-paid NHS jobs to better-qualified higher-paid ones. While the overall number of staff providing healthcare has fallen slightly by 6,104, it includes a greater proportion of doctors, particularly consultants. It would be difficult to work out on a like-for-like basis, but given the significantly higher wages of doctors this doesn’t look like an economy drive.
The main reason the overall number of FTE posts has fallen by 24,221 since May 2010 is simple: the numbers of administrative staff (or ‘NHS infrastructure support’) have been slashed by 8.9%, with just 186,578 remaining. Managers, who are included in this category, are down a hefty 15.9%, with 35,550 left.
Broadly, of the NHS jobs lost since the election, a quarter were in management and a further half were in other administrative/infrastructure roles. The final quarter is made up of healthcare staff – but for each two nursing and clinical support posts cut, a new doctor or other qualified scientific/therapeutic/technical post has been added. It’s not just a case of NHS cuts – unless you’re an administrator or managers, in which case it is.
Where are the NHS jobs: the biggest employers mapped
| (All full time equivalent posts) | NHS jobs August 2012 | Change since May 10 | Change % |
| Doctors | 102,606 | 4,878 | 5.0 |
| (inc. consultants) | 39,528 | 2,766 | 7.5 |
| Nurses | 304,566 | -6,228 | -2.0 |
| Scientific, theraputic & technical | 132,461 | 2,761 | 2.1 |
| Ambulance | 17,693 | -34 | -0.2 |
| Clinical support | 288,527 | -7,481 | -2.5 |
| Administrative | 186,578 | -18,117 | -8.9 |
| (inc managers) | 35,550 | -6,717 | -15.9 |
| TOTAL | 1,032,431 | -24,221 | -2.3 |
